

Book Review: The Naked Entrepreneur by Troy Hazard and Maria Elita
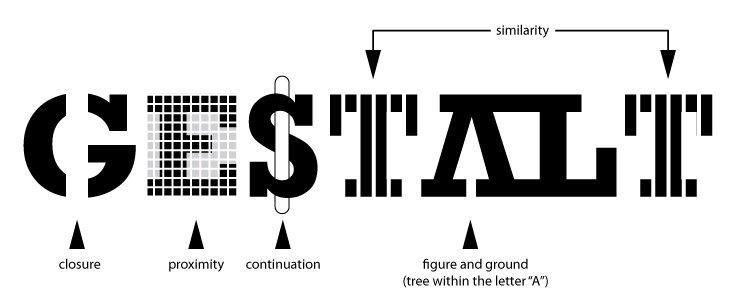
Gestalt Principles and Storytelling with Data

Summary: The purpose of this post is to start a dialogue on how to solve data literacy challenges; not with tools – but, by understanding the needs of the audience. The right data story is told when there is clarity in what is really important to the end-user.
Quick Reference:
- The Role of the Data Author
- Data Storytelling Visualization
- Know Your Audience
- Ask for Data Storytelling Help
“I don’t get it.” As a data owner, you may hear this from your audience from time to time. It’s because the data storytelling isn’t as effective as it needs to be. There may be more reliance on the visualization than the data going into the visualization – and that’s where the problem lies.
Data storytelling shouldn’t focus solely on the visual. What story are you trying to tell and who are you telling it to? This will set the vision and the narrative to ensure the correct data is being presented.
While it makes the data more interactive, it doesn’t necessarily develop the data story. You need the data presented in a way that people can use it, digest it, and make important decisions from it.
In order to develop the data story, you need to understand the audience. It ensures that the correct data stories are being told. Then, the visualization tool can show the work that has been created.
The best way to understand this is to look at data storytelling just as you would a fiction book.
In fiction, you are telling a story. You read the story in order to find out what happened. Maybe there are pictures, maybe there are none. You don’t need the pictures to tell you what happened. That’s what the story is there for. If there are pictures, it simply adds to the overall experience.
The Role of the Data Author

The author of a fiction story and a data owner has the same responsibilities:
- Understand the audience
- Tell a story
- Decide whether pictures help
Understanding the audience is, perhaps, the most important piece of the puzzle. The way the story is told will vary dramatically based on who is digesting it. Data storytelling involves figuring out who is going to read it. The way a data story is told to a CEO versus a CFO versus a frontline employee can be completely different.
A story needs to be told in such a way that it caters to that audience. There may be the need for more or fewer details based on who is going to read it – and even what they’re going to do with the information once it has been digested.
Then, the author can decide whether to add pictures. The pictures (or visualization tool) is based on the story, the story isn’t based on the pictures.
If you’re going to be an effective data storyteller, you have to know what your tools are and what your audience needs.
Data Storytelling Visualization

Data storytelling and data visualization go hand in hand. However, it’s important to rely more heavily on storytelling and, then, push the visualization as a way to further demonstrate a point.
Some of the different types of visualization being used include:
These tools are showing up on some of the various dashboards out there, making it easier for supervisors to CEOs to “get” the numbers being presented to them. Further, it ensures that the narrative around the visualization is appropriate to the audience.
Some of the tools are more popular than others. Bar charts and pie charts are popular because it makes the information easy to digest. Meanwhile, things like infographics have died because of being not only oversaturated in the marketplace but also leading to the blindness of the topic because of how the information was presented in such a scattered way.
Different tools need to be used based on the audience and how complex the material is being presented. You wouldn’t use a bar graph when a map is necessary. Similarly, timelines might be necessary for some instances to show how trends appear.
Know Your Audience

Anything having to do with marketing starts with knowing your audience. You should know who your audience is because it’s what drives everything that you do moving forward.
The way that you present to children is different than you present to adults. Children need a bird’s eye view of what’s going on where most adults need a worm’s eye view.
Data requires you to have an in-depth knowledge of your audience. Who are they? What role do they have? How is the data going to be used? What important decisions do they need to make with the data?
You won’t be able to tell a story until you can answer all of those questions. And even then, you will need to collect the data based on those details.
This is when data storytellers make the biggest mistake. They have the data, they use a visualization tool created by the data, and expecting the tool to speak for itself. The problem is that the story was told without an understanding of the audience.
The reality is that a specific story has to be told. Data has to be collected based on the story that is being told and, then, instructing the visualization tool to create a visual based on the specific data being fed to it.
When a data story tells a story to the desired audience that they want to hear, it leads to a higher level of engagement. Further, the visualization tool is chosen based on the type of data story being told as opposed to letting a dashboard randomly choosing a tool and hoping that it’s the best visual interpretation of the data.
Ask for Data Storytelling Help
Data storytelling is ineffective when it’s to the wrong audience or the visualization tools are incapable of offering clarity. Telling a story effectively can lead to better decision-making and better insight.
Asking for help can ensure you know what tools are out there as well as how you need to interpret the data. You don’t want to get into a situation where you’re overwhelmed. Further, you don’t want to do everything only for it to be ineffective.
Choosing a consultant to advise you in the early stages of developing a data story is always highly recommended. It can ensure that you’ve thought of everything needed to make the experience that much better.
It all comes down to better ownership. Data owners need to be more control of the data that they own and wield it more effectively in order to tell a story. The best authors use words and include pictures for fun. The best data storytellers use data and include visualization tools as a bonus for comprehension.


