
Better Data Storytelling: From Numbers to Narrative

Mitsubishi Evolution vs Subaru Impreza – Old School Rules
What is “Last Mile of Analytics”
Summary: The purpose of this post is to define the phrase “Last Mile of Analytics” from my perspective. This is a 101 level post that is targeted to those who don’t have a complete understanding of the phrase. As a 101 level post, it will be a high-level overview that will serve as a starting point only.

Quick Reference:
- Defining the Last Mile of Analytics
- Last Mile of Analytics and Digital Transformation
- Data Storytelling to the Rescue
- To Hire or Not To Hire
- Conclusion – Something To Remember
Defining the Last Mile of Analytics
What is the Last Mile of Analytics? It’s defined as the gap between data (answers) and the changed behavior associated with those answers. Many organizations have adopted sophisticated data ingestion, distribution, and visualization solutions to help cure the need for insights or delivery of data. The challenge is that many are now uncovering a dormant issue that most tools are not able to satisfy – Effective data communication that is intuitive and comprehendible for the end-user. The lack of knowledge regarding the customers’ needs, expectations, and requirements when it comes to using the data is usually the villain in this scenario. Why is that?
Many successful products have enjoyed their successes by clearly identifying the customer persona and having intimate knowledge of their journey (user case/needs). Most of these great products that embody the customer persona and journey have seen exponential growth and capture the market better than it’s rivals.
Companies like Apple, Google, Telsa, to name a few, listen to how the end-user really uses their product in order to build intuitive solutions. Sometime even going further by building in features that the user did not know they needed, causing the “intuitive effect”.
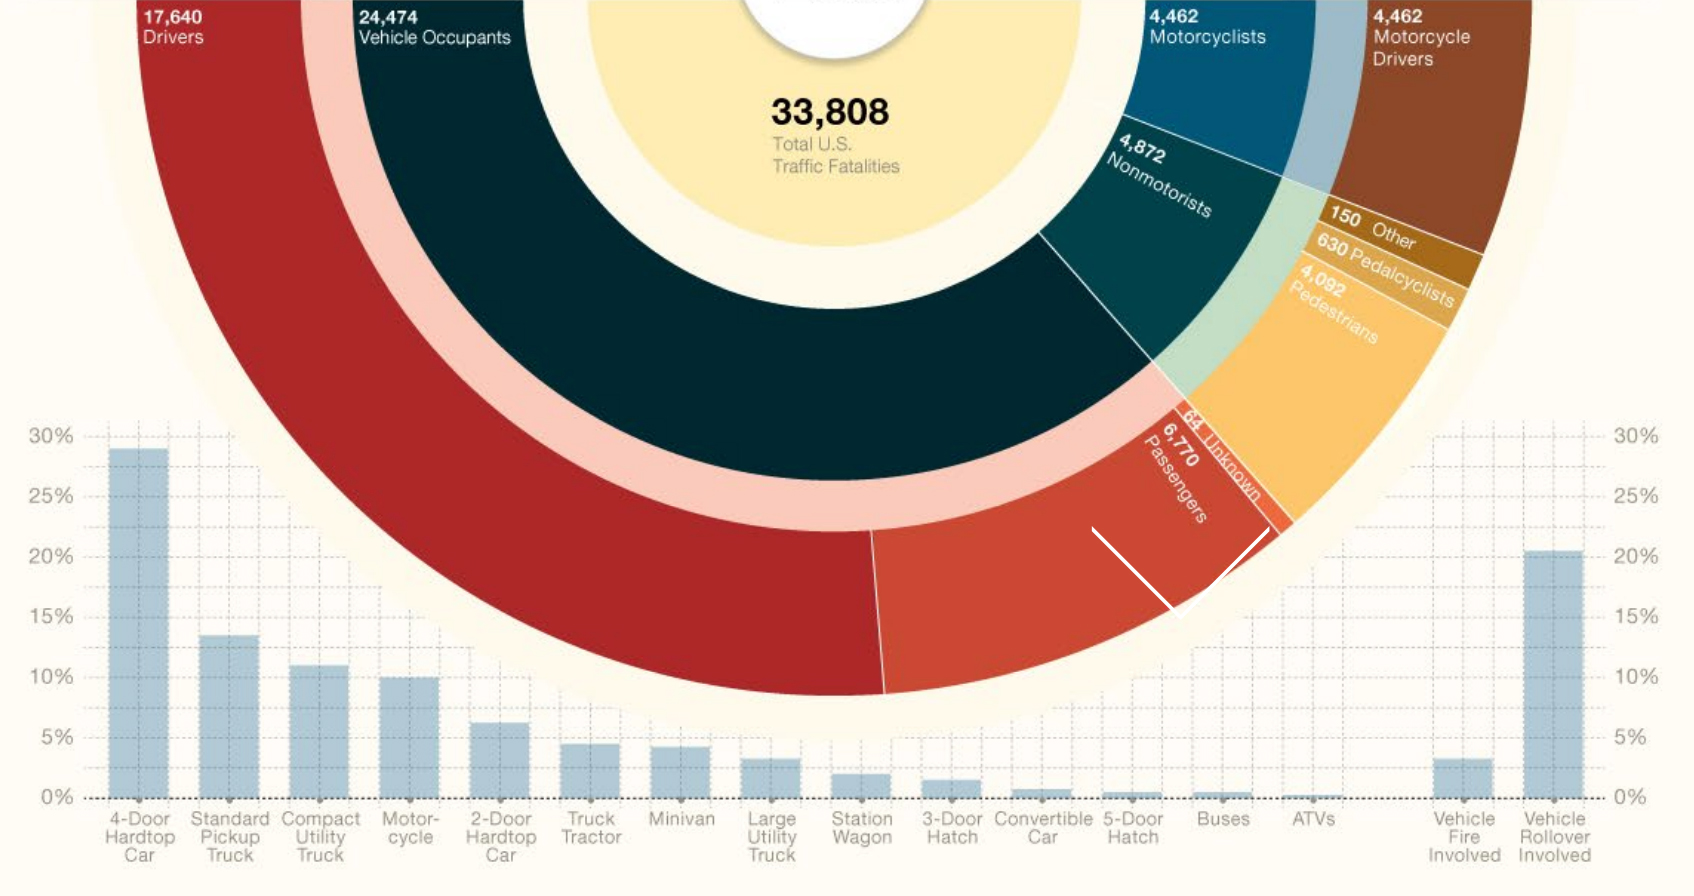
The same theory can be applied to data by developing a unique story curated into a solution that addresses the user’s needs. Data storytelling is often related to Data Visualization. The difference being is that the process of storytelling takes into account all available data and the appropriate logic in order to further enhance the experience for the user (to fit their needs).
Data Visualization is simply the process of graphically representing data, which serves its role when the data story is determined. The process of storytelling with data isn’t easy and requires an investment of time and resources to pull it off. Once a story is determined, choosing the right solution (tool/platform) to act as the story’s vessel will then complete the analytic journey.
Last Mile of Analytics and Digital Transformation
The entire analytics distribution process is a large undertaking. Most organizations define and plan for the following:
Assigning a Data Owner – A data owner is an individual who is accountable for the data asset. This is typically an executive role that heads the department, team or business unit that owns the data asset.
Data Collection/Ingestion – The process of importing, transferring, loading and processing data for later use or storage in a database environment is called Data ingestion and this involves loading data from a variety of sources, altering and modification of individual data sources and formatting them to fit into a larger document.
Enterprise Data Storage and Distribution Environment – Enterprise data storage and distribution is a centralized repository for business information that provides common data management, protection and data sharing functions through connections to systems via API’s and other means. Other important aspects of an enterprise storage system are unlimited connectivity and support for multiple platforms/environments.
Data Analysis – Data analysis is a process of inspecting, cleansing, transforming and modeling data with the goal of discovering useful information, informing conclusion and supporting decision-making.
Data Visualization – Data visualization is the representation of data or information in a graph, chart, or other visual formats. It communicates relationships of the data with images. This is important because it allows trends and patterns to be more easily seen.
Once the Data Visualization stage is completed, it’s at this point where the data owner realizes the return on its data distribution investment. The realization that the insights being delivered are not understood and even worse, the data provided isn’t enough to solve the use case becomes the elephant in the room.
At this stage, heavier investment is put into the Data Analysis and Data Visualization in hopes of being able to produce insights that are understood. End results have either been customized dashboards that provide a dump of visualized data for the user to dig through or reports/presentations that are created manually via PowerPoint to include data with narratives in order to cure the lack of understanding.
The real solution isn’t fixed by a tool, but rather through the process of determining what ingredients are needed to create the perfect data story experience to satisfy the user’s needs.
Data Storytelling to the Rescue
What does the data storytelling process look like:
- Understand the data and it’s value
- Know the end-user and what’s important to them via use cases
- How should the data be delivered to satisfy the user’s use cases
- Measure/test via focus groups
- Evolve and add more data when the user is ready
We all start as novices when it comes to things we don’t understand. The trick is to realize that the end user will be at a novice level when it comes to understanding the data and knowing how to leverage it. Keeping this learning curve in mind allows for future rollouts of features and enhancements to add more data and features to the mix. This will prevent users from being thrown into the deep end too quickly and provide the opportunity to gradually dive in. (More on Data StoryTelling)
To Hire or Not To Hire
The questions I commonly ask by those who are interested in solving their last mile of analytics challenges:
- How urgent is it to solve the challenge?
- Do you have resources internally who have experience solving challenges like this?
- What’s the process like to hire and train new staff (timeline and internal red tape)?
- Do you have a vendor currently who has experience solving challenges like this?
- What’s the process to onboard new vendors (timeline and internal red tape)?
Typically if organizations are aware of the problem, then there’s a sense of urgency to solve it. The dilemma then becomes on deciding the best course of action: leverage internal resources, hire vendors, or a little of both. In general, the data owner should have experience creating and launching products prior to tackle something like this. If that’s missing, typically the product development life cycle takes longer which adds to more resource time invested to complete the end solution.
Using a football analogy, you could have a team with all the best players in the NFL, but if you don’t have an experienced Superbowl winning coach/staff then getting to the big show will take a long time. The same could be said if you had an experienced data owner but not having the right players on your team, which will be costly.
The most cost-effective and efficient solution will be a hybrid setup with a vendor who has experience resolving these challenges many times and has a process that will integrate members of your internal staff in order to minimize cost.
Conclusion – Something To Remember
From a recent Gartner article: “Data and analytics are the key accelerants of an organization’s digitization and transformation efforts. Yet today, fewer than 50% of documented corporate strategies mention data and analytics as fundamental components for delivering enterprise value.
Gartner predicts that this will change quickly. By 2022, 90% of corporate strategies will explicitly mention information as a critical enterprise asset and analytics as an essential competency.”
The ability to efficiently communicate data to the end-user will define an organization’s ability to maximize its data potential. Data complexity will increase every step of the way, which will require data comprehension to increase along with it. Without a plan to bridge the data understanding gap, organizations will fall victim in the fight to stay competitive using data.
Now is the time to address these data communication challenges the right way and I hope this article helps as a starting point. If you need any more motivation to get started, this quote from Gartner should do the trick:
“A company’s ability to compete in the emerging digital economy will require faster-paced, forward-looking decisions,” says Douglas Laney, distinguished VP analyst at Gartner. “Data and analytics leaders need to assert themselves into corporate strategic planning to ensure that data and analytics competencies are incorporated within the highest-level public-facing enterprise plans.”


